Astrophysics
Contents
Astrophysics is a field in astronomy that investigates the physical and chemical properties and structures of astronomical objects and spacetime.
Computational astrophysics covers all the computational methods and tools developed for astrophysical studies.
It provides theoretical astronomy with unique opportunities for experiments by simulations, and it also provides observational astronomy with tools, predictions, and analysis methods.
Consequently, the mission of computational astrophysics is to act as a bridge between theory and observations.
Research Goals
- To study various aspects of turbulence and dissipation in the cosmic large-scale plasma through high-resolution simulations
- To provide and test the stochastic sub-grid models that are suitable for various astrophysical phenomena and are based on cosmological galaxy formation and evolution models, including magnetic fields
- To perform magnetohydrodynamic simulations using polarized radiative transfer calculations to understand the magnetic properties of star-forming regions
- To calculate the Ly-α line profiles using Monte Carlo radiative transfer methods in order to understand the properties of star-forming galaxies in the early universe
Major Results
Prof. Dongsu Ryu (Center Director) is carrying out theoretical and computational studies of the non-thermal processes and various plasma phenomena in cosmic large-scale structures, including shock waves, turbulence, magnetic fields, and high-energy particles.
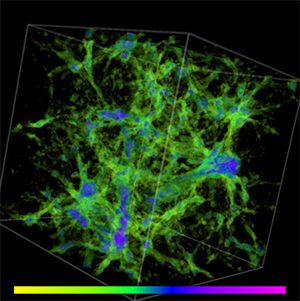
Magnetic fields predicted in (130 Mpc)3 space. Color bars represent the magnetic intensities (Yellow: B = 10-10 G, Violet: B = 10-5 G).
Dr. Jongsoo Kim investigated the star-forming processes in turbulent molecular clouds using numerical methods to understand the properties of the turbulence, the mass function of cores, the magnetic fields, and the polarizations.
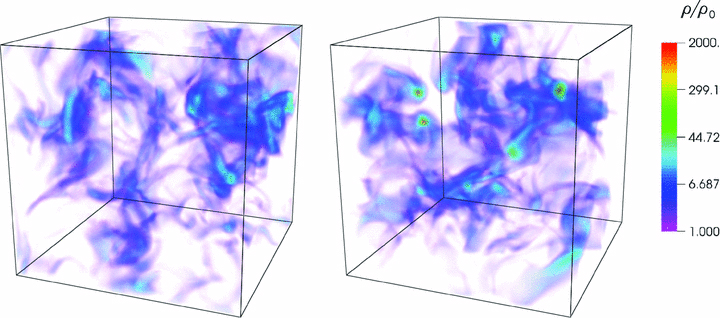
Initial density map of the turbulent medium (left panel) and that of the same medium after 1.2 free-fall time evolution under self-gravitation (right panel).
Dr. Minsu Shin performed numerical simulations to study the interaction between galaxies and intergalactic media in dense regions of the universe and found that a turbulent medium loses its mass more easily and that the mass loss efficiency varies with the relative directions of galaxy movement and magnetic fields.
Dr. Sang-Hyeon Ahn (Prime Investigator) investigated the Ly-α line formation mechanism in starburst galaxies in the early universe having P-Cygni-type line profiles. Ly-α radiative transfer calculations using the Monte Carlo method showed the existence of an expanding shell of neutral hydrogen with a column density of 1019-21 cm-2.
Calculated Ly-α line profiles for a source surrounded by a shell of neutral hydrogen expanding at 200 km/s.
To explain the general cases of a single peak, dust should be distributed inside the shell as well as within the shell itself.
Facilities
- Third-Generation Cluster machine (2013) for KVN correlation calculations: 36 servers having 592 cores and 1,776 GB of memory, and an FDR (56 Gbps) Infiniband network with a total of 200 TB of storage
- Upgraded in 2016 to 100 Gbps Infiniband Lustre file system with a total storage capacity of 1,300 TB
Group Meetings
- We are holding monthly KNAG(Korean Numerical Astrophysics Group) mini-workshops.